Introducing Insights: the smart, flexible reporting dashboards that will help you get the most out of your data – in less time than ever before.
7.5 hours. Yes – that’s on average how long resource managers spend translating data and trying to turn it into meaningful reports.
In our 2025 State of Resource Management research, we found that reporting was a commonly cited time-sink that monopolises the attention of resource managers.
Yet, despite all the effort that’s going in, people aren’t even that happy with the output. 51% of organizations we asked said that they were "reactive" in their resource management approach, largely due to data management issues preventing them from getting the insights that would help them move quickly and plan ahead.
Bet you can relate — us too.
Yes, data is critical for saving organizations money, even bringing in new revenue while maintaining employee engagement.
But practically? Well, you know just how challenging (and time-consuming) working with all that data is. Especially when the data sits across spreadsheets and a hodge-podge of tools – by the time you clean, sort, and interpret the data, the moment to act has already passed.
Questionable data quality is definitely the biggest culprit here. Take it from your peers. Only 10% of resource managers who took our survey said they wholly trusted their data.
Siloed systems and fragmented records lead to decentralized access to data, and manual, non-standardized inputs increase the risk of errors and reporting inconsistency.
Unfortunately, this means that resource managers end up spending far too long just trying to collate and curate resource data before they can even start working with it.
At Runn, we hate the idea of people’s precious time and energy being squandered on frustrating, manual tasks when there’s more interesting, strategic work that could be done.
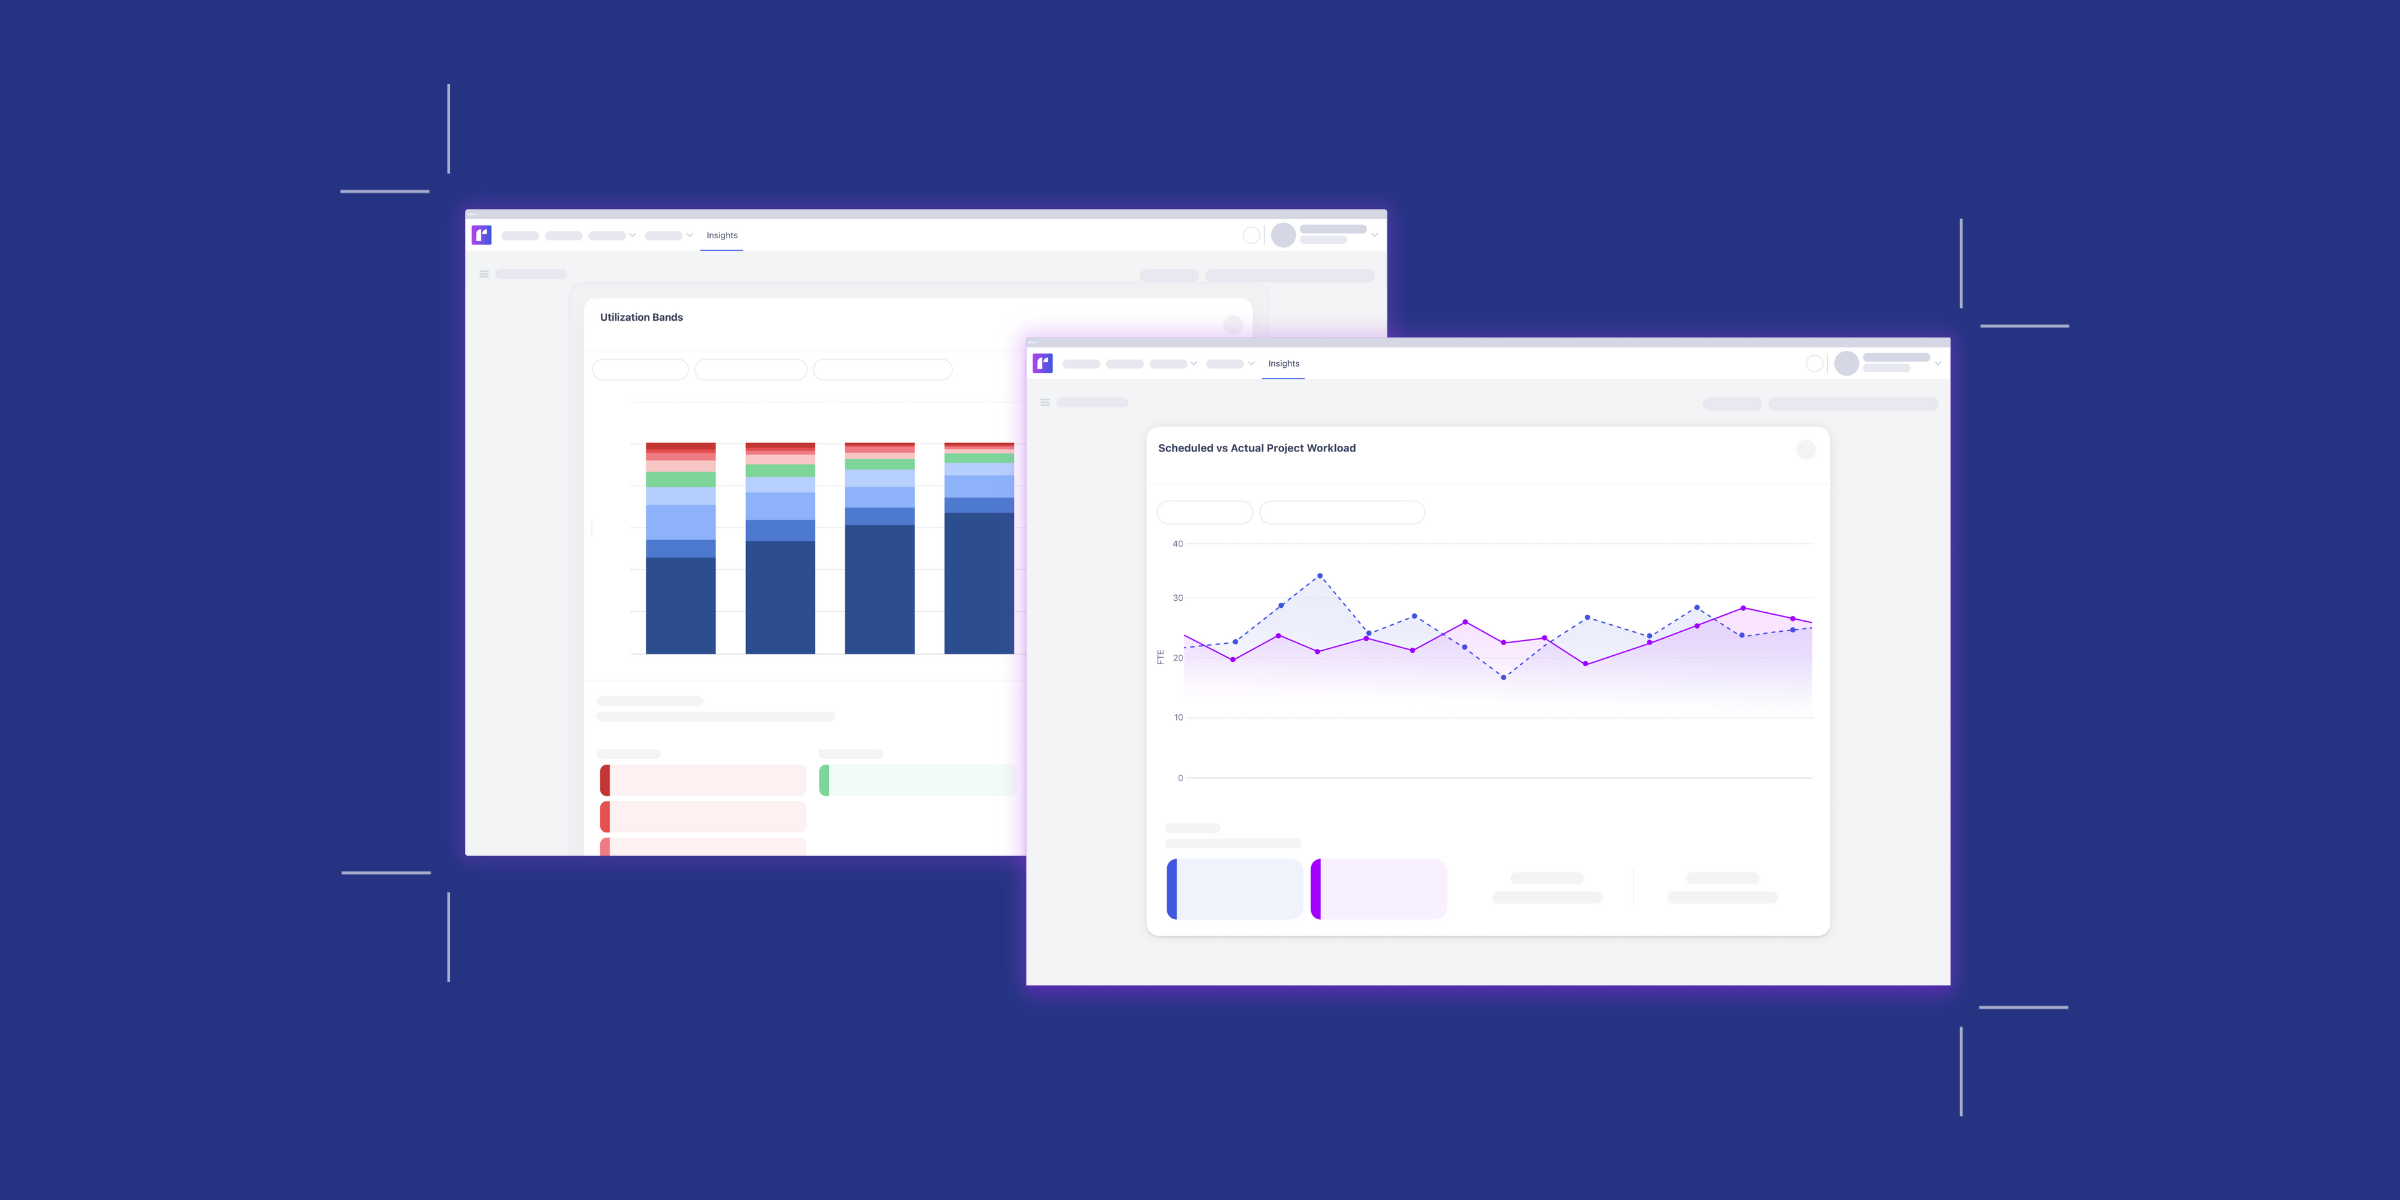
That’s why we’re introducing Insights – the new suite of reporting dashboards that will revolutionize the way you look at resource data.
Let’s take you through them.
Insights are a stack of reporting-ready dashboards packed with workforce data to help you make smarter decisions, faster.
The idea here is simple: to make it easy for you to move from sorting data… to actually using it.
The leadership-ready visual data hub gives you real-time insights into four key areas: capacity, performance, utilization, and workforce.
Each dashboard, in turn, packs in super-specific data, making them instantly actionable.
For example, in the workforce dashboard, you’ll find data on contracts ending soon, capacity by employment type (full-time or contractor), business cost by employment type, and workload by employment type among other useful snapshots.
Instead of stitching together multiple reports, you can get a quick pulse on business health and act on it with confidence.
If you’re already on a Premium or Enterprise plan with Runn, you’ll find a tab for Insights next to the Reports tab. If you’re on a legacy plan and would like to try Insights to save time on data reporting and make more confident, data-backed decisions, reach out to our customer success team.
Insights pulls out data in easy-to-read dashboards from four key areas: utilization, workforce, capacity, and performance. This means you can quickly grab data in these areas, and even filter it by teams, skills, and roles.
For example, Insights now makes it quick and easy for you to...
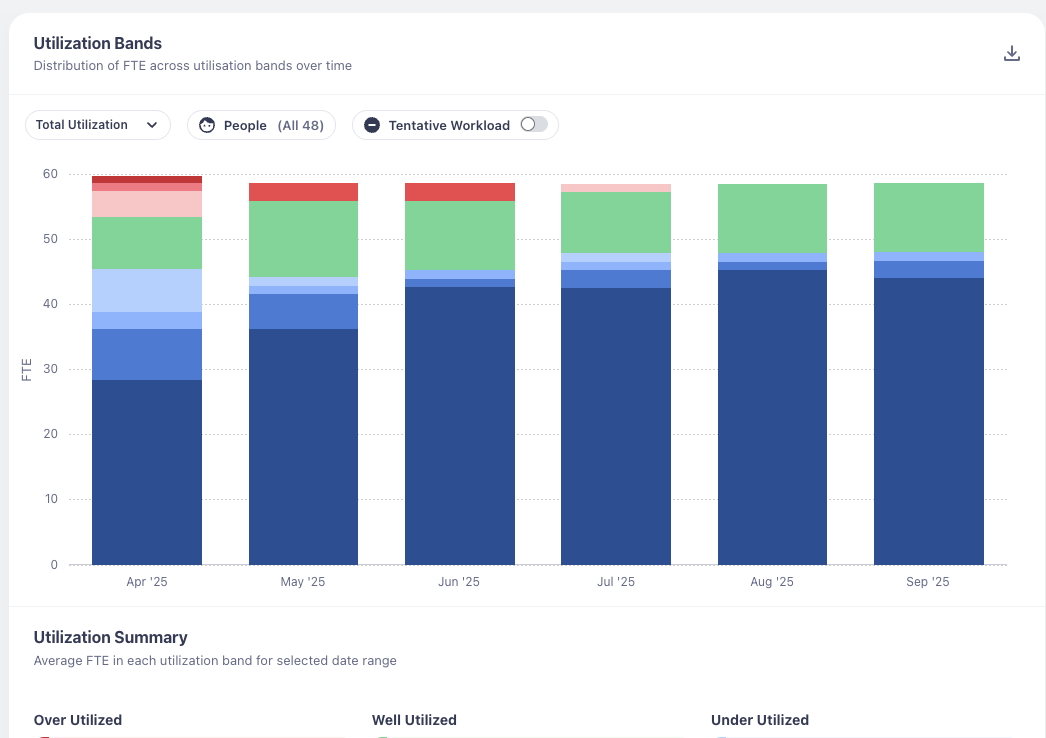
Let’s say you’re trying to understand and improve utilization across employees and teams. In the utilization dashboard, you can see an instant overview of utilization levels across your workforce, and see how utilization breaks down into billable and non-billable work.
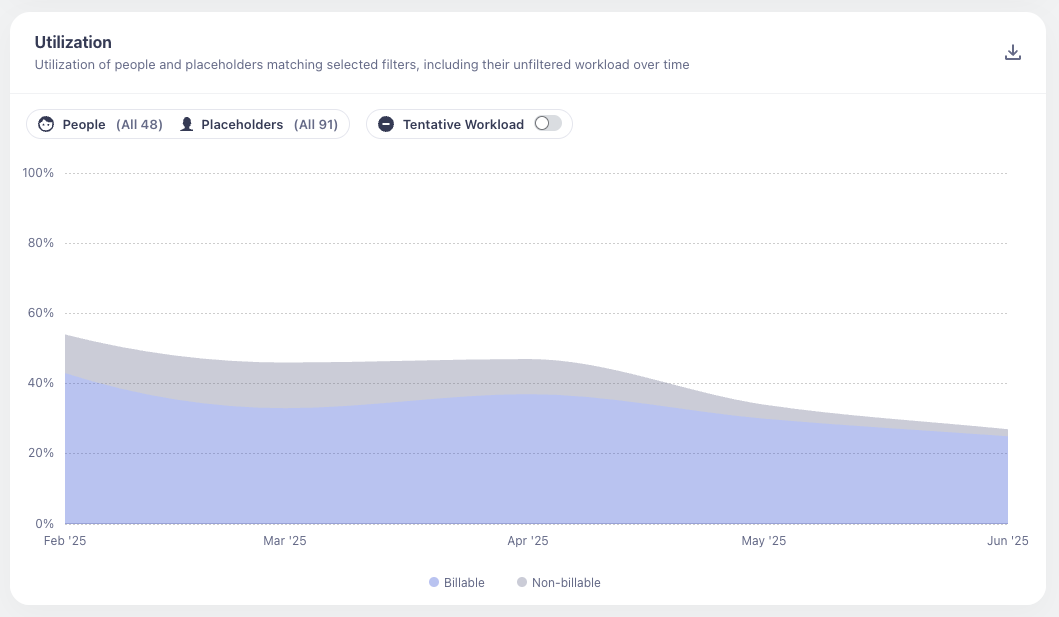
You can see who is overutilized, even drilling down into utilization on a person-by-person level, so you can take measures to optimize their utilization and save individuals from burnout.
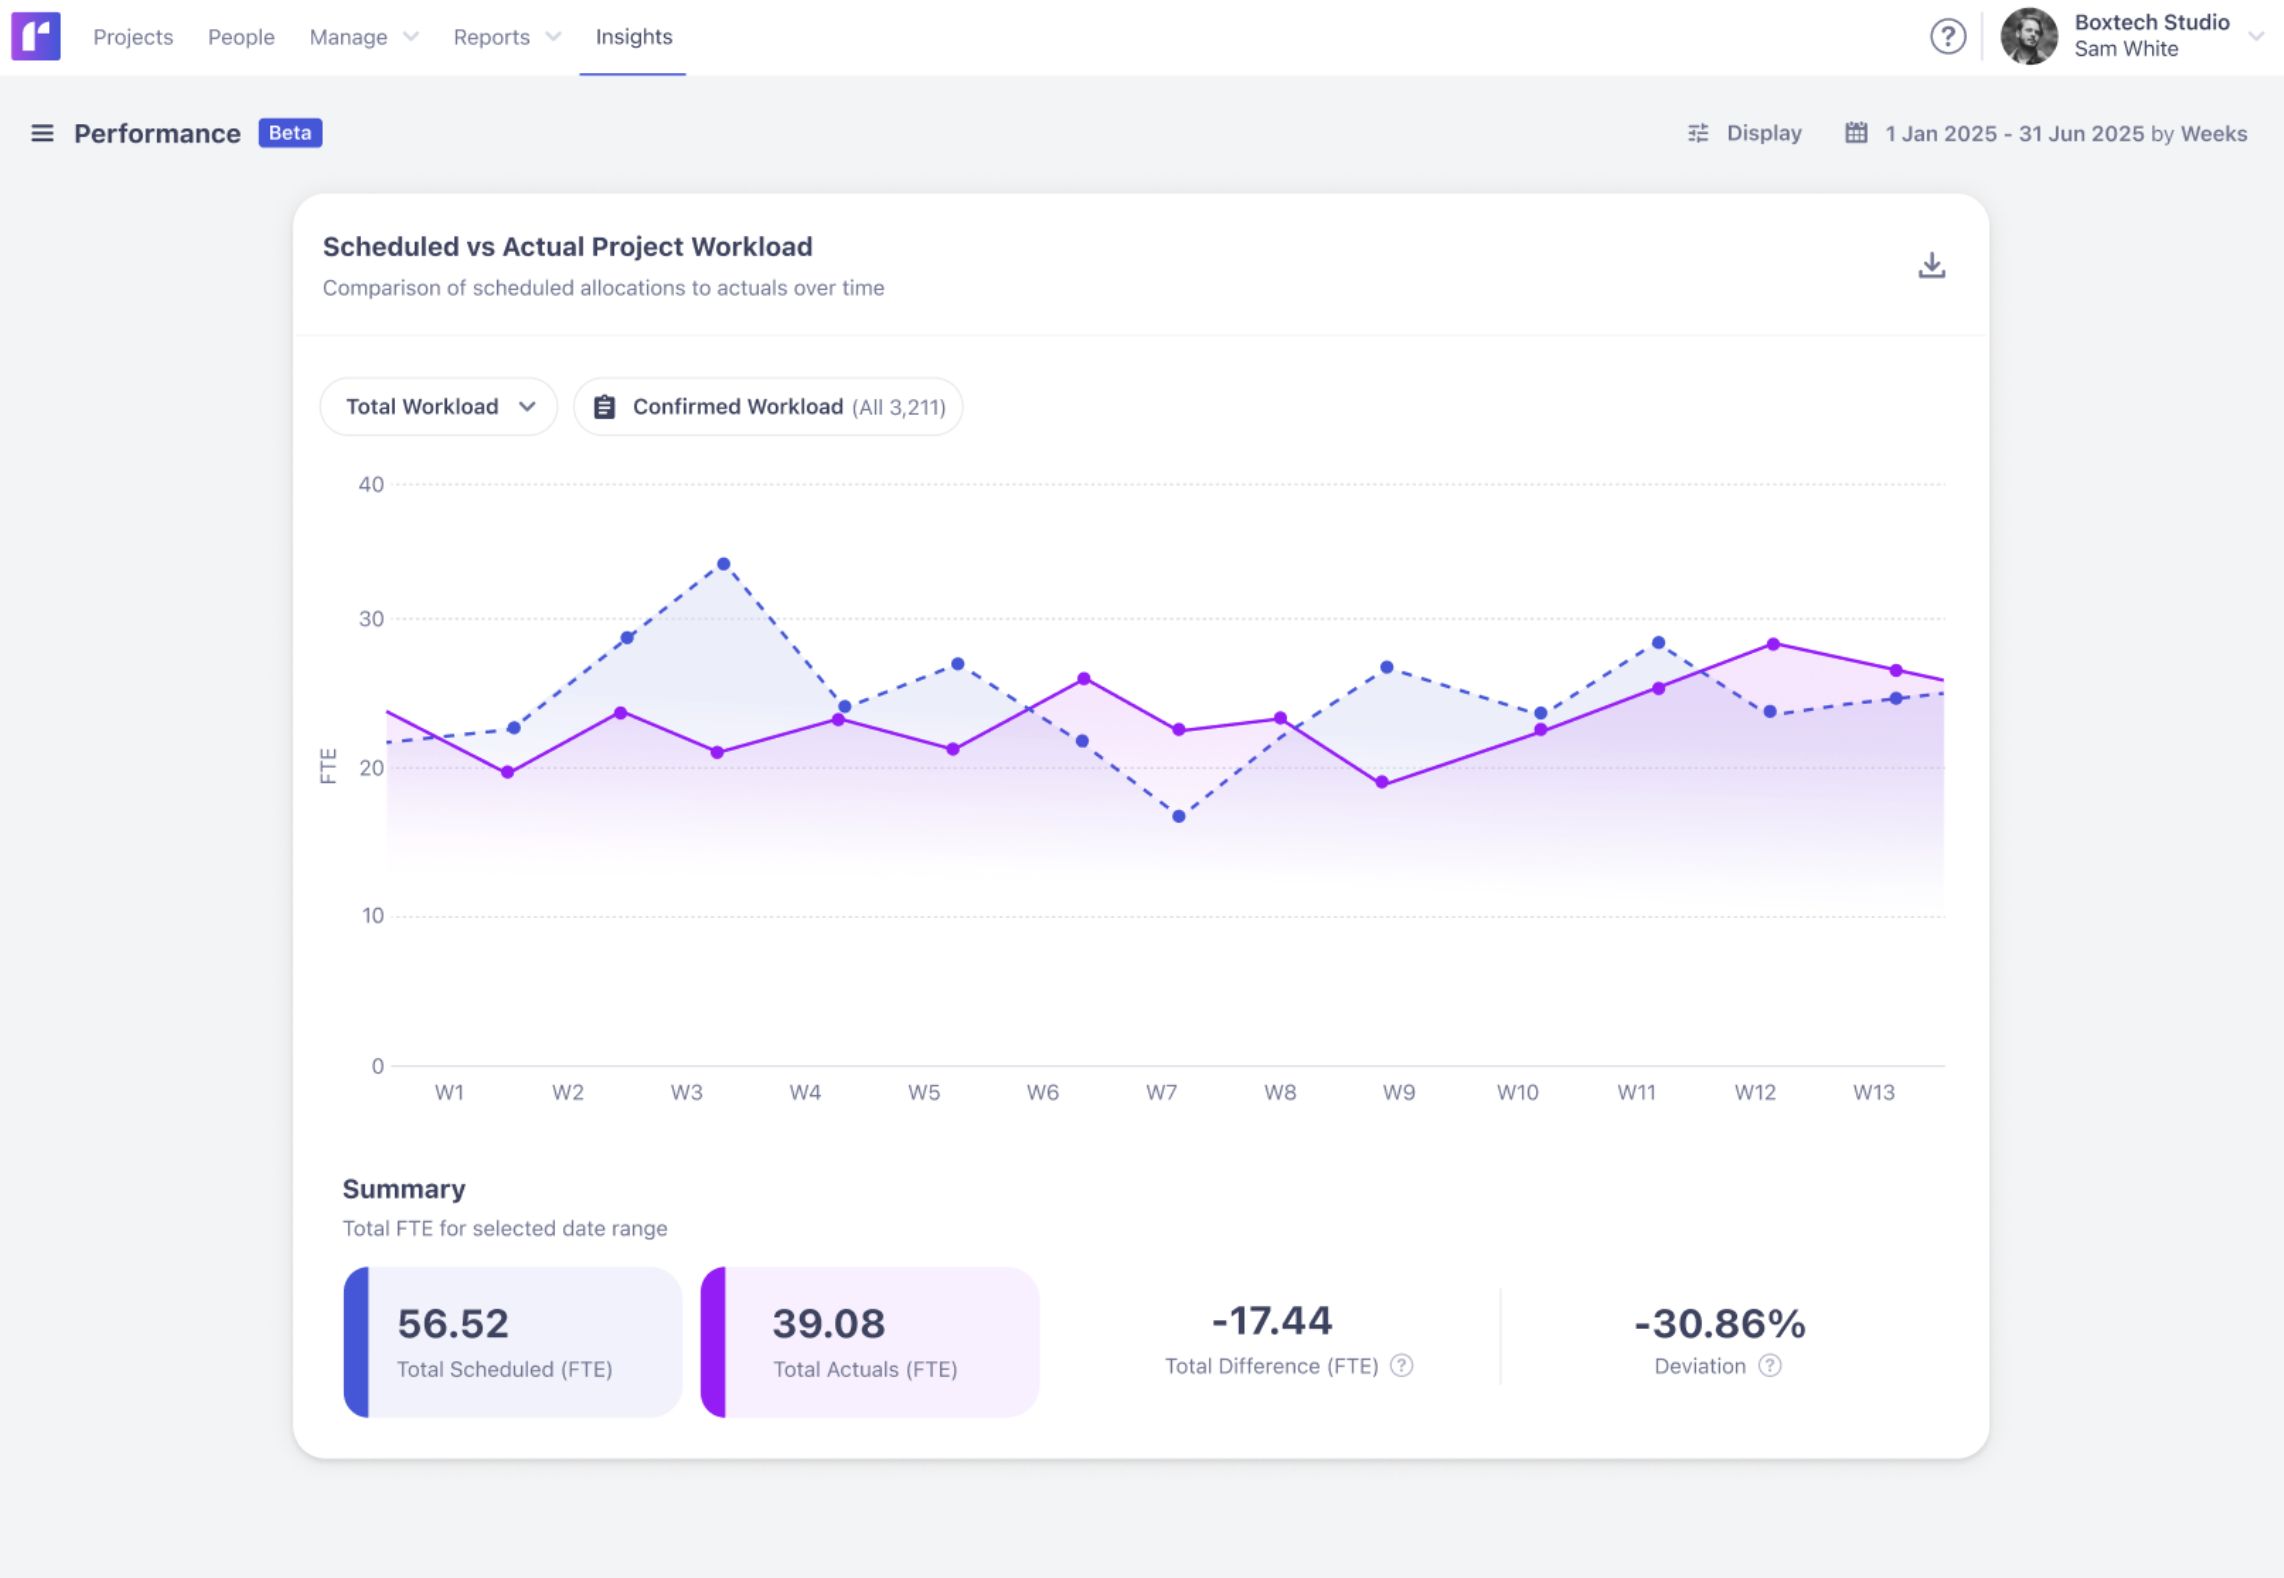
Besides data on utilization, you can also use Insights to track performance and capacity.
For instance, by leveraging performance insights, you can easily review a project’s total scheduled workload, actual (worked) hours, and spot the discrepancy between the two, improving project planning and team productivity by using the data to make needed changes.
You can also create private dashboards to track the data most relevant to your resource management goals, so you can stay laser-focused on the KPIs that move the needle the most in your business.
How you use Insights in Runn depends entirely on your goals. That's why we've built it to be flexible and intuitive to use, along with the usual attention to well-designed, beautiful visual details that you can always expect from us!
Want to dig deeper into Insights? Check out our lowdown on what’s inside Insights.


