Resource managers lose around 15% of their work week to reporting. If you think resource reporting really shouldn't take so much time, have a look at this...

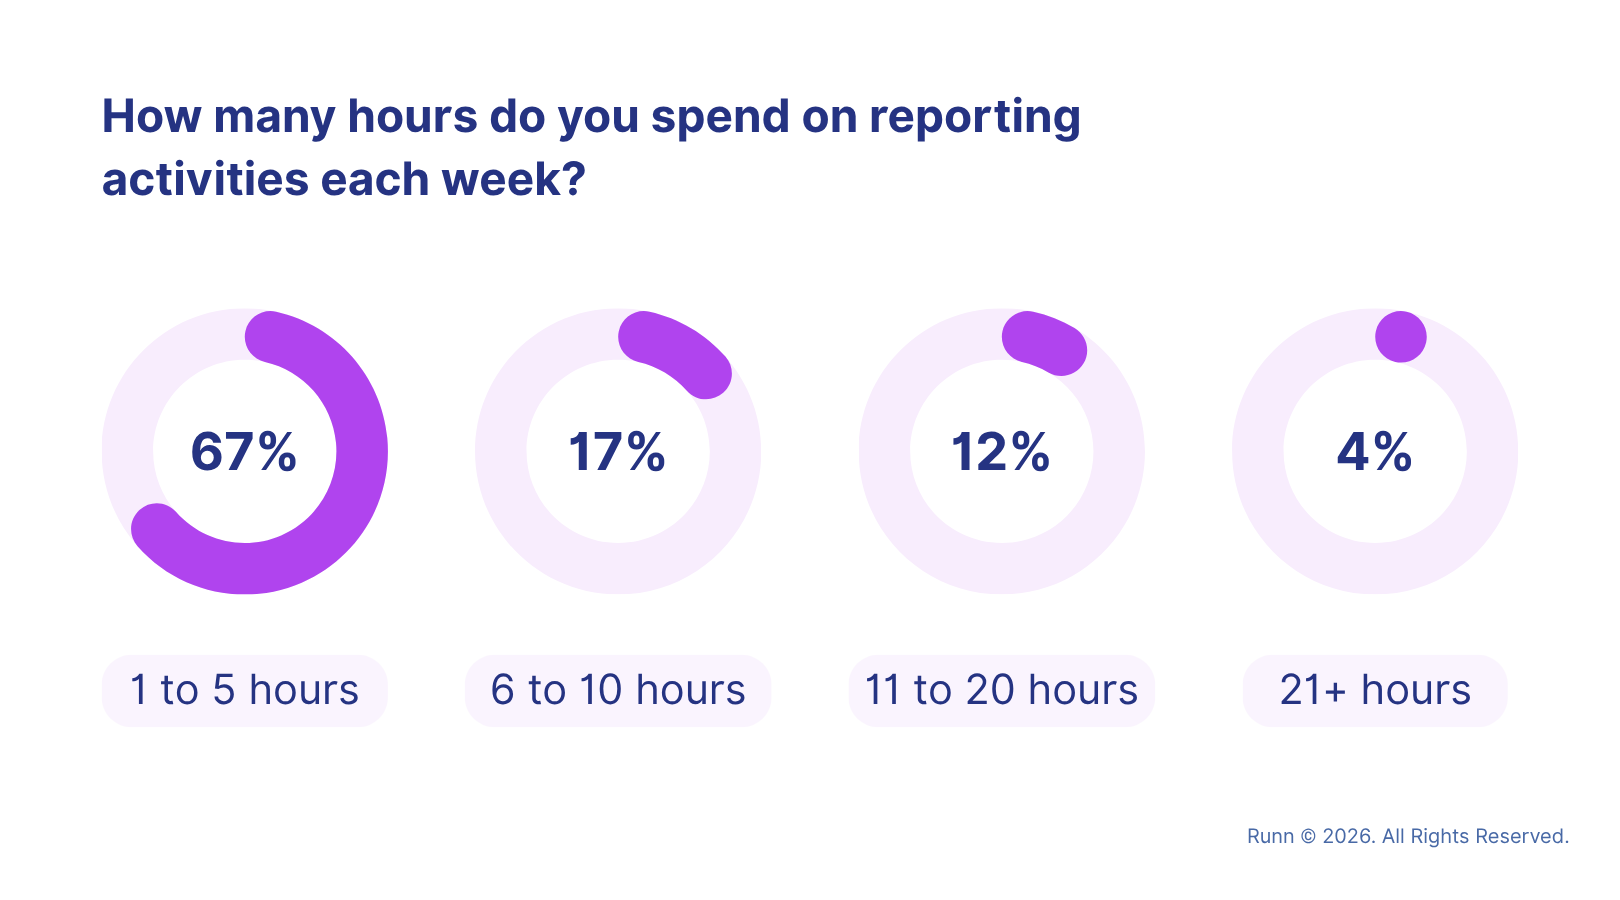
If you find yourself forever sifting through folders of spreadsheets to do your reporting, you’re not alone. In our State of Resource Management 2026 research, we found that resource managers spend an average of 6.5 hours weekly on reporting.
That's almost a full work day, every week, lost to number-crunching and hunting down bits of data hiding across systems that don't cooperate.
For some resource management professionals, it's even more time than this, with 12% dedicating a gruelling 11 to 20 hours every week to resource reporting. Painful!
You’d think, at the very least, that all this time and effort would amount to something. But it turns out, for many people, it doesn’t.
Here’s the real kicker: just 9% of our survey respondents said they had complete faith in the data they gather and analyze.
So, what's the solution to this wasted time and poor outcomes? Custom reports in Runn that easily halve the time you’re spending on reporting.
In this guide, we’ll take you through how you can track essential resource and project management data in half the time you’re already dedicating it. We’ll discuss everything – from how to create the report, to how to isolate specific data to make informed decisions.
Manual processes and a lack of visibility into resource availability surfaced as the leading inhibitors to effective resource management in our research. This is despite the fact that more than 60% of respondents highlighted resource allocation, scheduling accuracy, and resource utilization as priorities areas for their resource management function.
Of course, we hold data management – the way you gather, study, access, and use data – as one of the core reasons behind this lag.
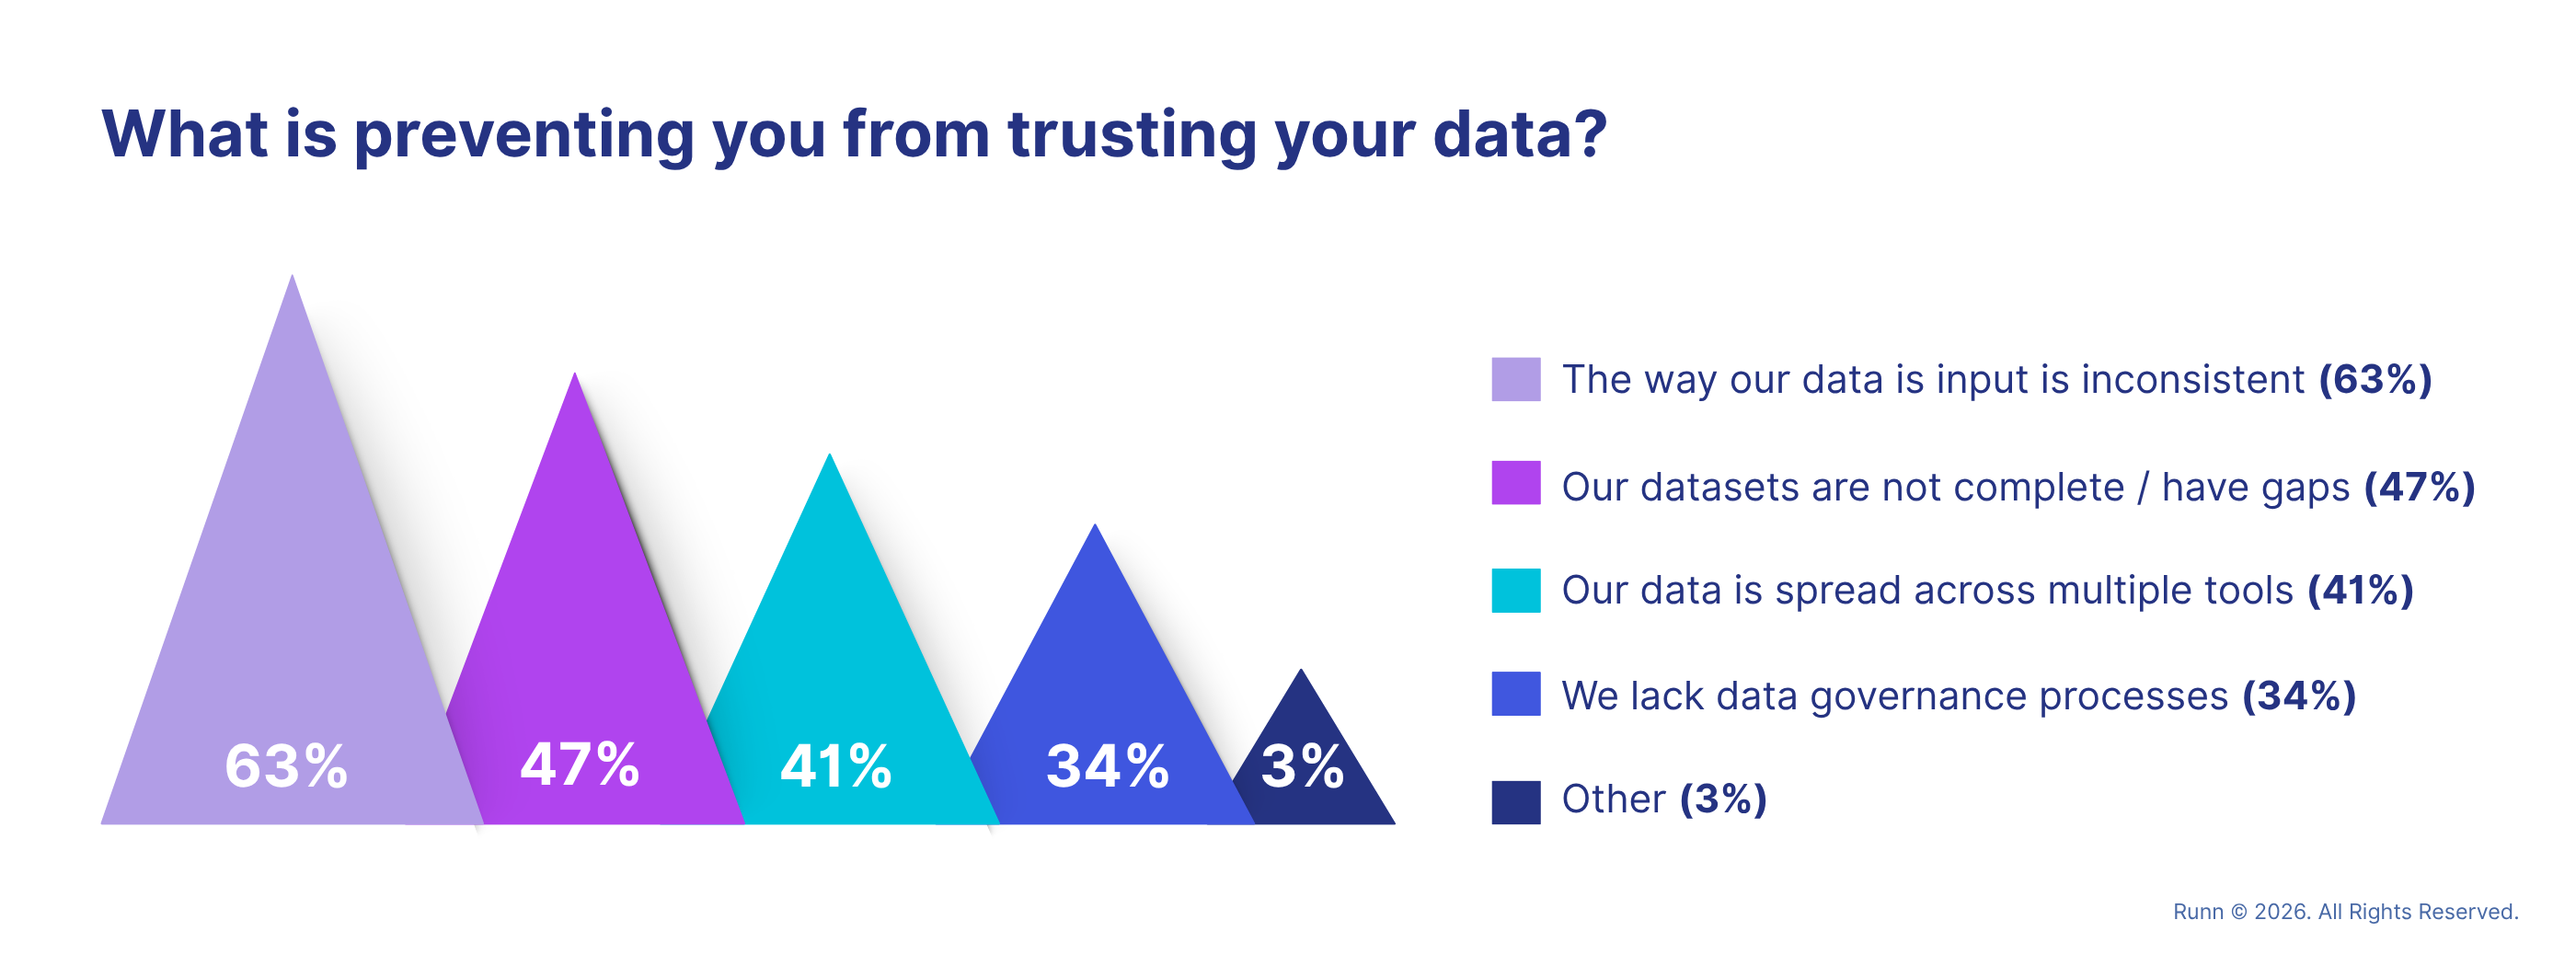
Not to mention, trust in data is another factor. In fact, in our survey, we found that only just over half of respondents (54%) wholly trust their data or feel it's mostly accurate. The rest have no or only partial trust in their data.
.png)
And it turns out, all this mistrust in data comes from four key constraints:
Frankly, none of this comes as a surprise. Years of experience and conversations with resource managers has taught us that resource reporting is a time-consuming drudgery that many folks dread. The data only confirmed what we already knew.
But since our goal here at Runn is to assist you in unlocking a certain level of resource management maturity, we naturally had to come up with a solution. It’s here that Custom Reports started to shape up as a way to simplify and help you save time in data analysis.
Related read: What Data Do You Need to Do Resource Management Properly? ➡️
Custom reporting in Runn helps centralize data management, reducing data quality issues and improving your ability to meaningfully access your data as a result.
If you’re already a Runn user, you’ll find Custom Reports under your Reports dashboard. These are personalized, unique-to-your-goals reports that you can create in minutes, featuring metrics essential to your workflows, tracking data over pre-determined timelines.
Of course, you can start with Presets too. Presets are report templates in Runn that have the same fields and metrics pre-built into each report. They serve as an effective starting point if you are not ready to create your custom report yet.
You can also add other relevant metrics to a preset (but you’ll be prompted to create a new report from it as presets can’t be saved).
Here’s a complete breakdown of custom reports in Runn:
Any good report begins with a clear understanding of its goals and needs. Answer these key questions for a strong head start:
For instance, your goal may be to improve resource allocation in the next quarter. In that case, you’ll want to track data under multiple categories: project data, capacity, and resource utilization.
Dig deeper: A Kinder Way to Interpret Utilization Rates ➡️
Within these categories, you’ll want to decide on and track specific metrics such as billable and non-billable hours and resource utilization rate (under utilization), and forecasted versus actual allocation and resource capacity (under capacity metrics).
Once you have a clear idea of the specific data you want to track according to your goals, head to the Reports tab in your dashboard.
Now select a preset (pre-created by Runn) to build your custom report. Here, choose your preferred view before moving forward.
Next, settle on the projects you want to track data on. Note that you’ve the option to include tentative projects here if you’d like.
This gives you the flexibility to easily review the impact of tentative projects on your project pipeline, resource availability and capacity, and financials. In turn, this allows you to stay ahead of the planning curve to reduce project risks and increase profitability without burning out your team.
Pro tip: Using the Filter tab in the report header, you can filter and review data in various ways such as by team, role, skills, job titles, etc. If you’re looking for a specific person or project, simply use the search bar to quickly find them:
Moving on, head to Columns in your report’s header.
When you click Columns, you’ll see that it opens up a menu of collapsed parent metrics: Project, Person, Financials, etc.
As you click on one, you’ll see specific metrics like email, job, title, team, and so on open under each. Check and uncheck items here to include particular metrics in your report.
Once done, click on Group to move metrics around and set them up in the right order for you. You’ll see that the report has a detailed view by default – if that’s not your preference, simply remove it from under the Group column.
Don’t forget to click Apply to save all the changes you make here.
You’re nearly done now – just select a Custom Date Range or Period to prescribe your report’s timeline.
When you’re done, you’ll see two options: Change made to the report and Create Report.
Click on the Create Report button, name it, and hit Create — you’re all done. You’ll find this new report at the bottom of the Reports tab. You can also simply search for it in the search bar in the Reports section.
You can both create new custom reports following the same steps shared above or make new ones from the custom report you just made.
When you’re tracking the same data for a new period, for instance, the second option will come in handy. All you need to do is go under Columns and select your metrics. But instead of clicking Save Changes, click on Create New Report. That’s it – easy peasy!
As you’ll have already noted, Custom Reports make it easy to track data in one place, all automatically, after you’ve selected the metrics you want to track.
This solves three major data management challenges resource managers regularly wrangle with:
The best part is you can toggle on tentative projects. This way, you can review project and resource metrics both with projects already in your pipeline and with those anticipated, so you can plan accordingly.
The right data facilitates proactive resource management. Thankfully, by creating custom reports, tracking, and analyzing data won’t be a time drain.
Have more questions? Find your answers here or talk to a member of our team ➡️


